
6.4 Transformations Of Trigonometric Functions
Transformations applied to trigonometric functions have the same format as other functions although there is a trig function combined within the equation such as sin, cos, tan...ect. There are multiple strategies assiciated with graphing or determining new points on a transformed function. Lets take a look at a basic y=sin(x) function and explore some of the transformations that can be applied.
Method 1: Table of Values
Step 1) If you are transforming points from a parent function what you can do is create a table of values listing the points in order from 0 to 2π or what ever your interval is.
Step 2) Divide the transformations and translations by horizontal and vertical. Make sure before transforming to simplify the braket if applicable.
Step 3) Apply the transformations one at a time remembering BEDMAS and applying multiplying or dividing transformations first.
-6sin(4x-π/2) -3
-6sin4(x-π/8) -3
Vertical Translations
[(1 x -6) -3)]
= -6 -3
= -9
Horizontal Translations
[(π/2/4) + π/8)]
= π/2 x 1/4
= π/8 + π/8
=2π/8
=π/4
Therefore the new point is now (π/4,-9)
Method 2: Graphing Technology
Step 1) You can use graphing technology to solve or check your work. You will be able to see the general functions shape and your transformed points.
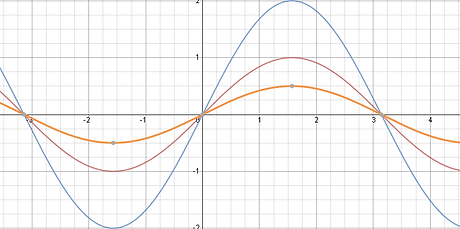
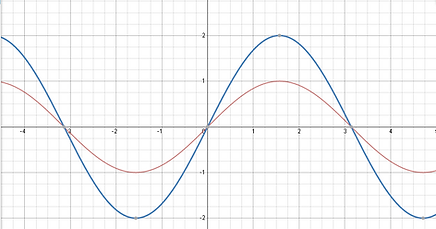
[A - Value] The function above is y=2sin(x) . This transoformation means that the y-values are stretched by a factor of the coefficient of the a value which in this case is 2. As you can see the amplitude now stretches out to 2 and -2 on the y-axis on the blue graph on the right.
The maximum and minimum points on a sin graph are 1 and -1 and if you multiply both these values by the a value you get 2 and -2 which as you can see coorespond onto the graph. In addition to vertically stretching the sin graph you can also compress it this occurs when the a value is between 0 and 1 or 0 < a< 1. As you can see on the graph to the left the orange function is half of that of the original y=sin(x) (red) and if you multiply the max and min by 0.5 you get 1 x 0.5 = 0.5 -1 x 0.5 = -0.5 which compress vertically the whole graph.
Example 1
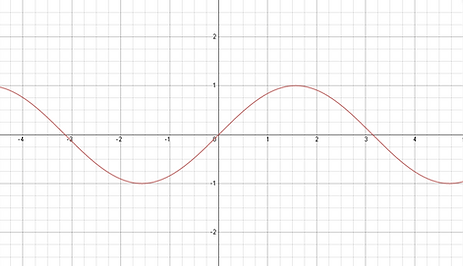
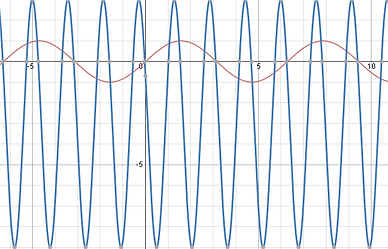
The y=sin(x) function can be transformed by using the equation y= afk(x-d)+c where the (f) or the function in this case is sin(x). Like in the previous units each transformation changes the fucntion in either the vertical or horizonal plane. For example the a value or also known as the amplitude vertically stretches or compresses the function depending on the coefficient. The k value stretches or compresses the function in the horizontal plane and is also responisble for changing the period of trigonometric functions. Due to their periodic nature sin, cos, tan...ect functions normally have a period of 2π or π. when changing the k value we also change the period or the length of one cycle. The d value or sometimes reffered to as h is responisble for horizontal transformations left or right. And c translates the function up or down. Lets look at some of the transformations compared to the base function.
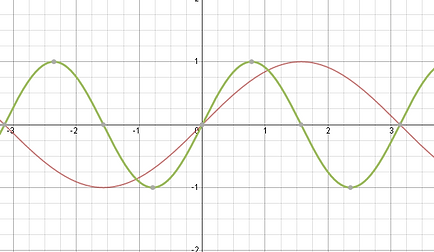
[k - Value] The normal period of a sin function is 2π and since these trigonometric functions are periodic they repeat for infinity. Changing the k value is changing the length of one cycle for example in the graph to the right the equation is defined as y=sin2(x) this means the y=sin(x) function has been horizontally compressed by a factor of two. Think of a spring being compressed the rings become more close together and when it is stretched they become furthur apart.
Calculating the period is defined by 2π/k you divide your original period by your k value which give you your new period. In the example to the left the period is 2π/2 or simplified as π. as you can see there are now two full cycles in the green graph eclipsing the original sin(x) function.
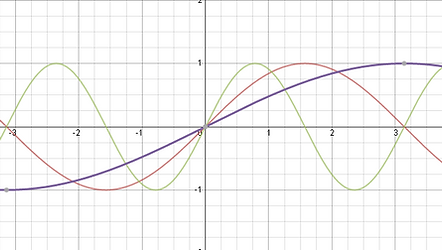
In the example to the right the purple graph is defined as y= sin0.5(x) which horizontally stretches the graph and as you can see the purple graph appears to be more streched out over the x-axis compared to the compressed and original sine graph. you can calculate this by 2π/0.5 or 4π which makes sense because the transformation is a horizontal stretch.
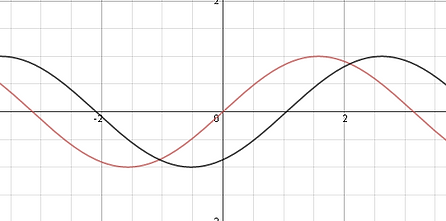
[D/H - Value] These values shift the graph horizontally to the left or right on the x-axis. The graph to the left is defined as y=sin(x-π/3) and is shifted to the right by π/3 units. Unlike the a and k values you are adding and subtracting the x values to get your new value. Since these are trigonometric functions their x axis are defined in radians because their periods are represented as 2π or π ect.
For instance if a point on your graph is (π/2, 1) the result would be that (π/2 + π/3),1)) this means youll have to use common denominators to solve this. ((3π/6 + 2π/6),1) or (5π/6, 1) is not the location of the new maximum and as you can see in the black graph the y=sin(x-π/3) function is slightly to the right of the original.
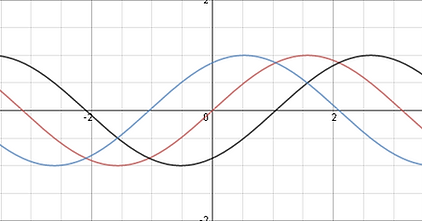
The graph to the right shows three graphs y=sin(x) (red), y=sin(x-π/3) (black) y=sin(x+π/3) (blue). This graph is shifted to the left by π/3 and you can see from the maximum or minimum points it is on the left side of the original sine(x) graph.
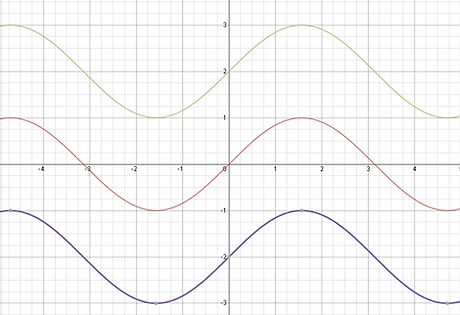
[C - Value] Lastly the c value is responsible for vertical translations up or down the graphs to the left are represented as y=sin(x) (red) y=sin(x)+2 as (green) and y=sin(x)-2 as (purple) as you can see the graph shifts down by a factor of the coefficient representing c. Like horizontal translations you add adn subtract the values rather than multiply/divide. For instance if the max and min are 1 and -1 and the tranformed equation is y=sin(x)+2 the new points are now (π/2, 2) and 3π/4, 1).
Given the equation -6sin(4x-π/2) -3 Determine the transformed point at (π/2, 1)
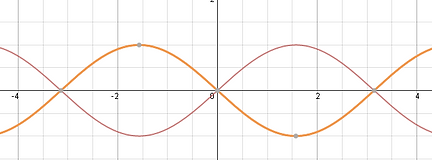
The sin function when there is negative on the a value the graph flips in the x and when there is a negative sign on the k the graph flips in the y axis however in a sin graph specifically these two flips or reflections become the same graph
Key Concepts/Tips
I'm aThe graphs of functions of the form f(x)= asin[k(x-d)]+ c and f(x)= acos[k(x-d]+c of the parent functions y=sin(x) and y=cos(x).
When given parts of the equation look for the amplitude, equation of axis, and period to help model your equation.
Remember: A value is responisble for vertical stretch or compression, k is the horizontal stretch or compression but also changes the period. The d value is the horizontal shift along the x-axis, and c is the vertical translation along the y-axis. To graph more cycles you can add multiples of the period, try to find the local maximum or minimum points to help determine amplitude and equation of axis.
Helpful Videos
Sample Questions
Level 1/2
State the period, amplitude, phase shift, and equation of axis for each function
A) y = -7cos(3x-π/2)+4
B) y = 3sin1/2(x+ π/4) + 5
C) y = 0.4cos1/4(x - 2π) -4
Level 3
Sketch the graphs from question 1.
A) y = -7cos(3x-π/2)+4
B) y = 3sin1/2(x+ π/4) + 5
C) y = 0.4cos1/4(x - 2π) -4