6.3 Exploring Graphs of The Primary Trigonometric Functions
Helpful Videos
The unit circle serves as an effective visual representation of radian measure. However, it is NOT an adequate representation of sinusoidal functions.
Instead, when we graph points, we observe that it is repeating. This is known as a periodic function.
YOU TRY! Using graphing technology, such as the graphing calculator provided below graph y=sinx, y=cosx and y=tanx.
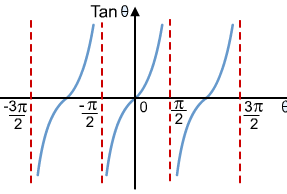
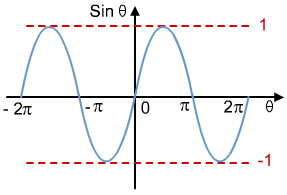
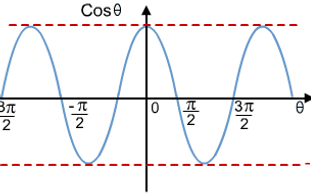
You should observe the following three graphs:


As you can see, the graphs of sinx and cosx share similar features, whereas tanx is a completely different graph. This is because tanx is essentially sinx/cosx and so the function will become undefined when x is equal to the zeroes of cosx (whenever cosx = 0, the denominator = 0 and the function becomes undefined). The vertical asymptotes are in place to prevent this from happening and the function (just like in rational functions!).
RECALL: The amplitude of a trigonometric functions is the distance to the maximum and the minimum values. It is found using: max. - min ÷ 2.
The period of a trigonometric function is the time it takes for the function to complete an entire cycle before repeating again.
The equation of the axis of symmetry is the equation of the horizontal line that is halfway between the maximum and the minimum values. It is found using: max + min ÷ 2.
Sample Questions
Level 1/2
Compare the graphs of y = sinx and y = cosx and include descriptions of the following properties: period, equation of axis, amplitude, max. and min values, domain and range.
Level 3
1) Why does y = tan(x) require vertical asymptotes in order to be defined? Why don’t the other sinusoidal functions require these asymptotes?
2) Write an expression which describes the location of the x-intercepts of y = sin (x),
y = cos(x) and y = tan(x), where n is an element of I?.
Key Concepts/Tips
The sin(x) graph has a period of 2π, t≥he equation of axis is 0 the amplitude is 1 the maximum = 1 minimum = -1 the domain is represented as D= {θER} the range is expressed as R= {yER// 1≥ y ≥ -1} The key points are between 0 < θ < 2π or (0,0) (π/2,1) (π,0) (3π/2,-1) and (2π,0).
The cos(x) graph has the same max and min values as well as same domain and range although its key points are between 0 < θ < 2π or (0,1) (π/2,0) (π,-1) (3π/2,0) and (2π,1). Same EQN of axis and amplitude for the parent function.
The tan(x) graph has a period of π the EQN of axis is 0 the amplitude is undefined due to its asymptotes, no maximum or min values its vertical asymptotes are defined as θ= ±π/2,±3π/2, ±5π/2.... Its range is defined as R= {YER} and its domain is defined as {θER/0≠ ±π/2,±3π/2, ±5π/2.... as well as its key points are its y intercept at 0 and its θ intercepts 0 = π , 2π...ect